Dataset: Sea Surface temperature MODIS-T 2001-2018
Document produced by http://www.marine-analyst.eu
18 January, 2021

1 MPA information
|
2 Data information
|
Monthly mean sea surface temperature (in degree-C at 4km resolution) derived from the MODIS-TERRA sensor (Satellite remote sensing Ocean color data): Sea surface temperature is the temperature of the water close to the sea surface. SST is a standard product from satellite-based thermal infra-red sensors, and optical sensors complemented with infrared bands.
|
Access metadata from landing page
3 Geographical extent
3.1 Coordinates
## [1] "West-Longitude: -109.44"## [1] "South-Latitude: 10.08"## [1] "East-Longitude: -109"## [1] "North-Latitude: 10.52"3.2 Defined area
 Map tiles by Stamen Design, under CC BY 3.0. Data by OpenStreetMap, under ODbL.
4 Analysis (graphs)
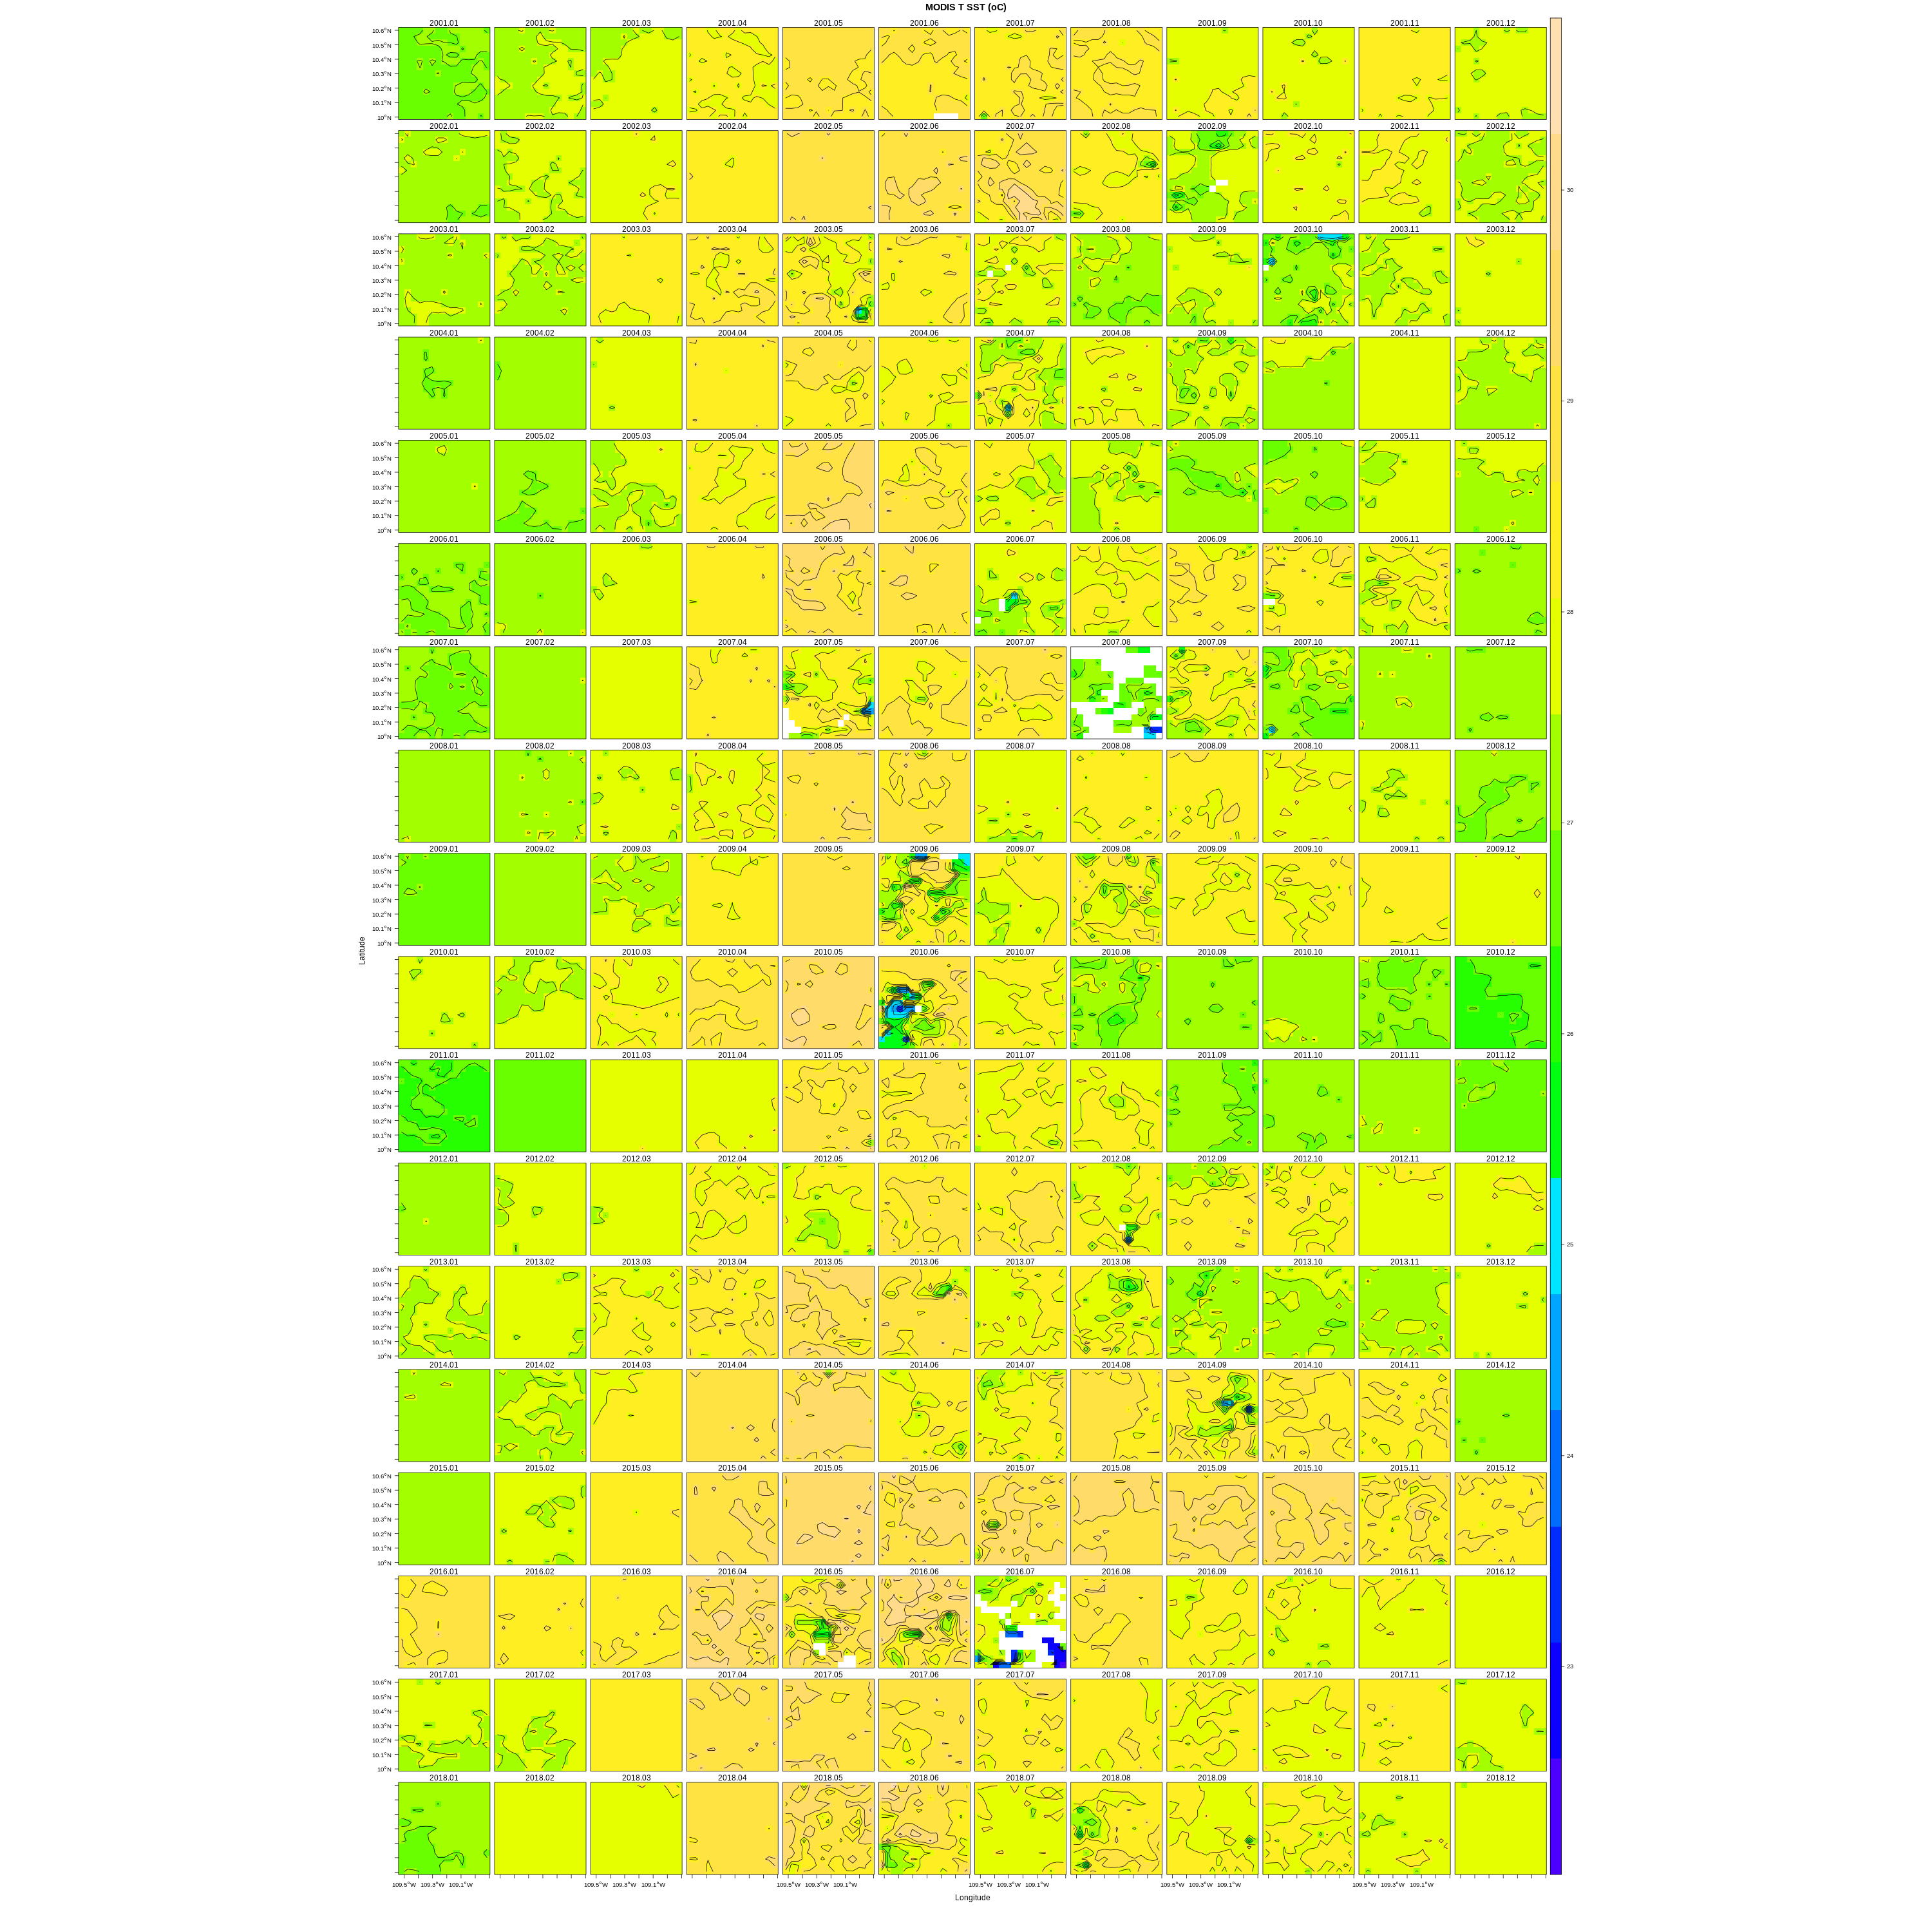
4.1 Monthly composite
4.2 Average

4.3 Monthly climatology

4.4 Monthly boxplot

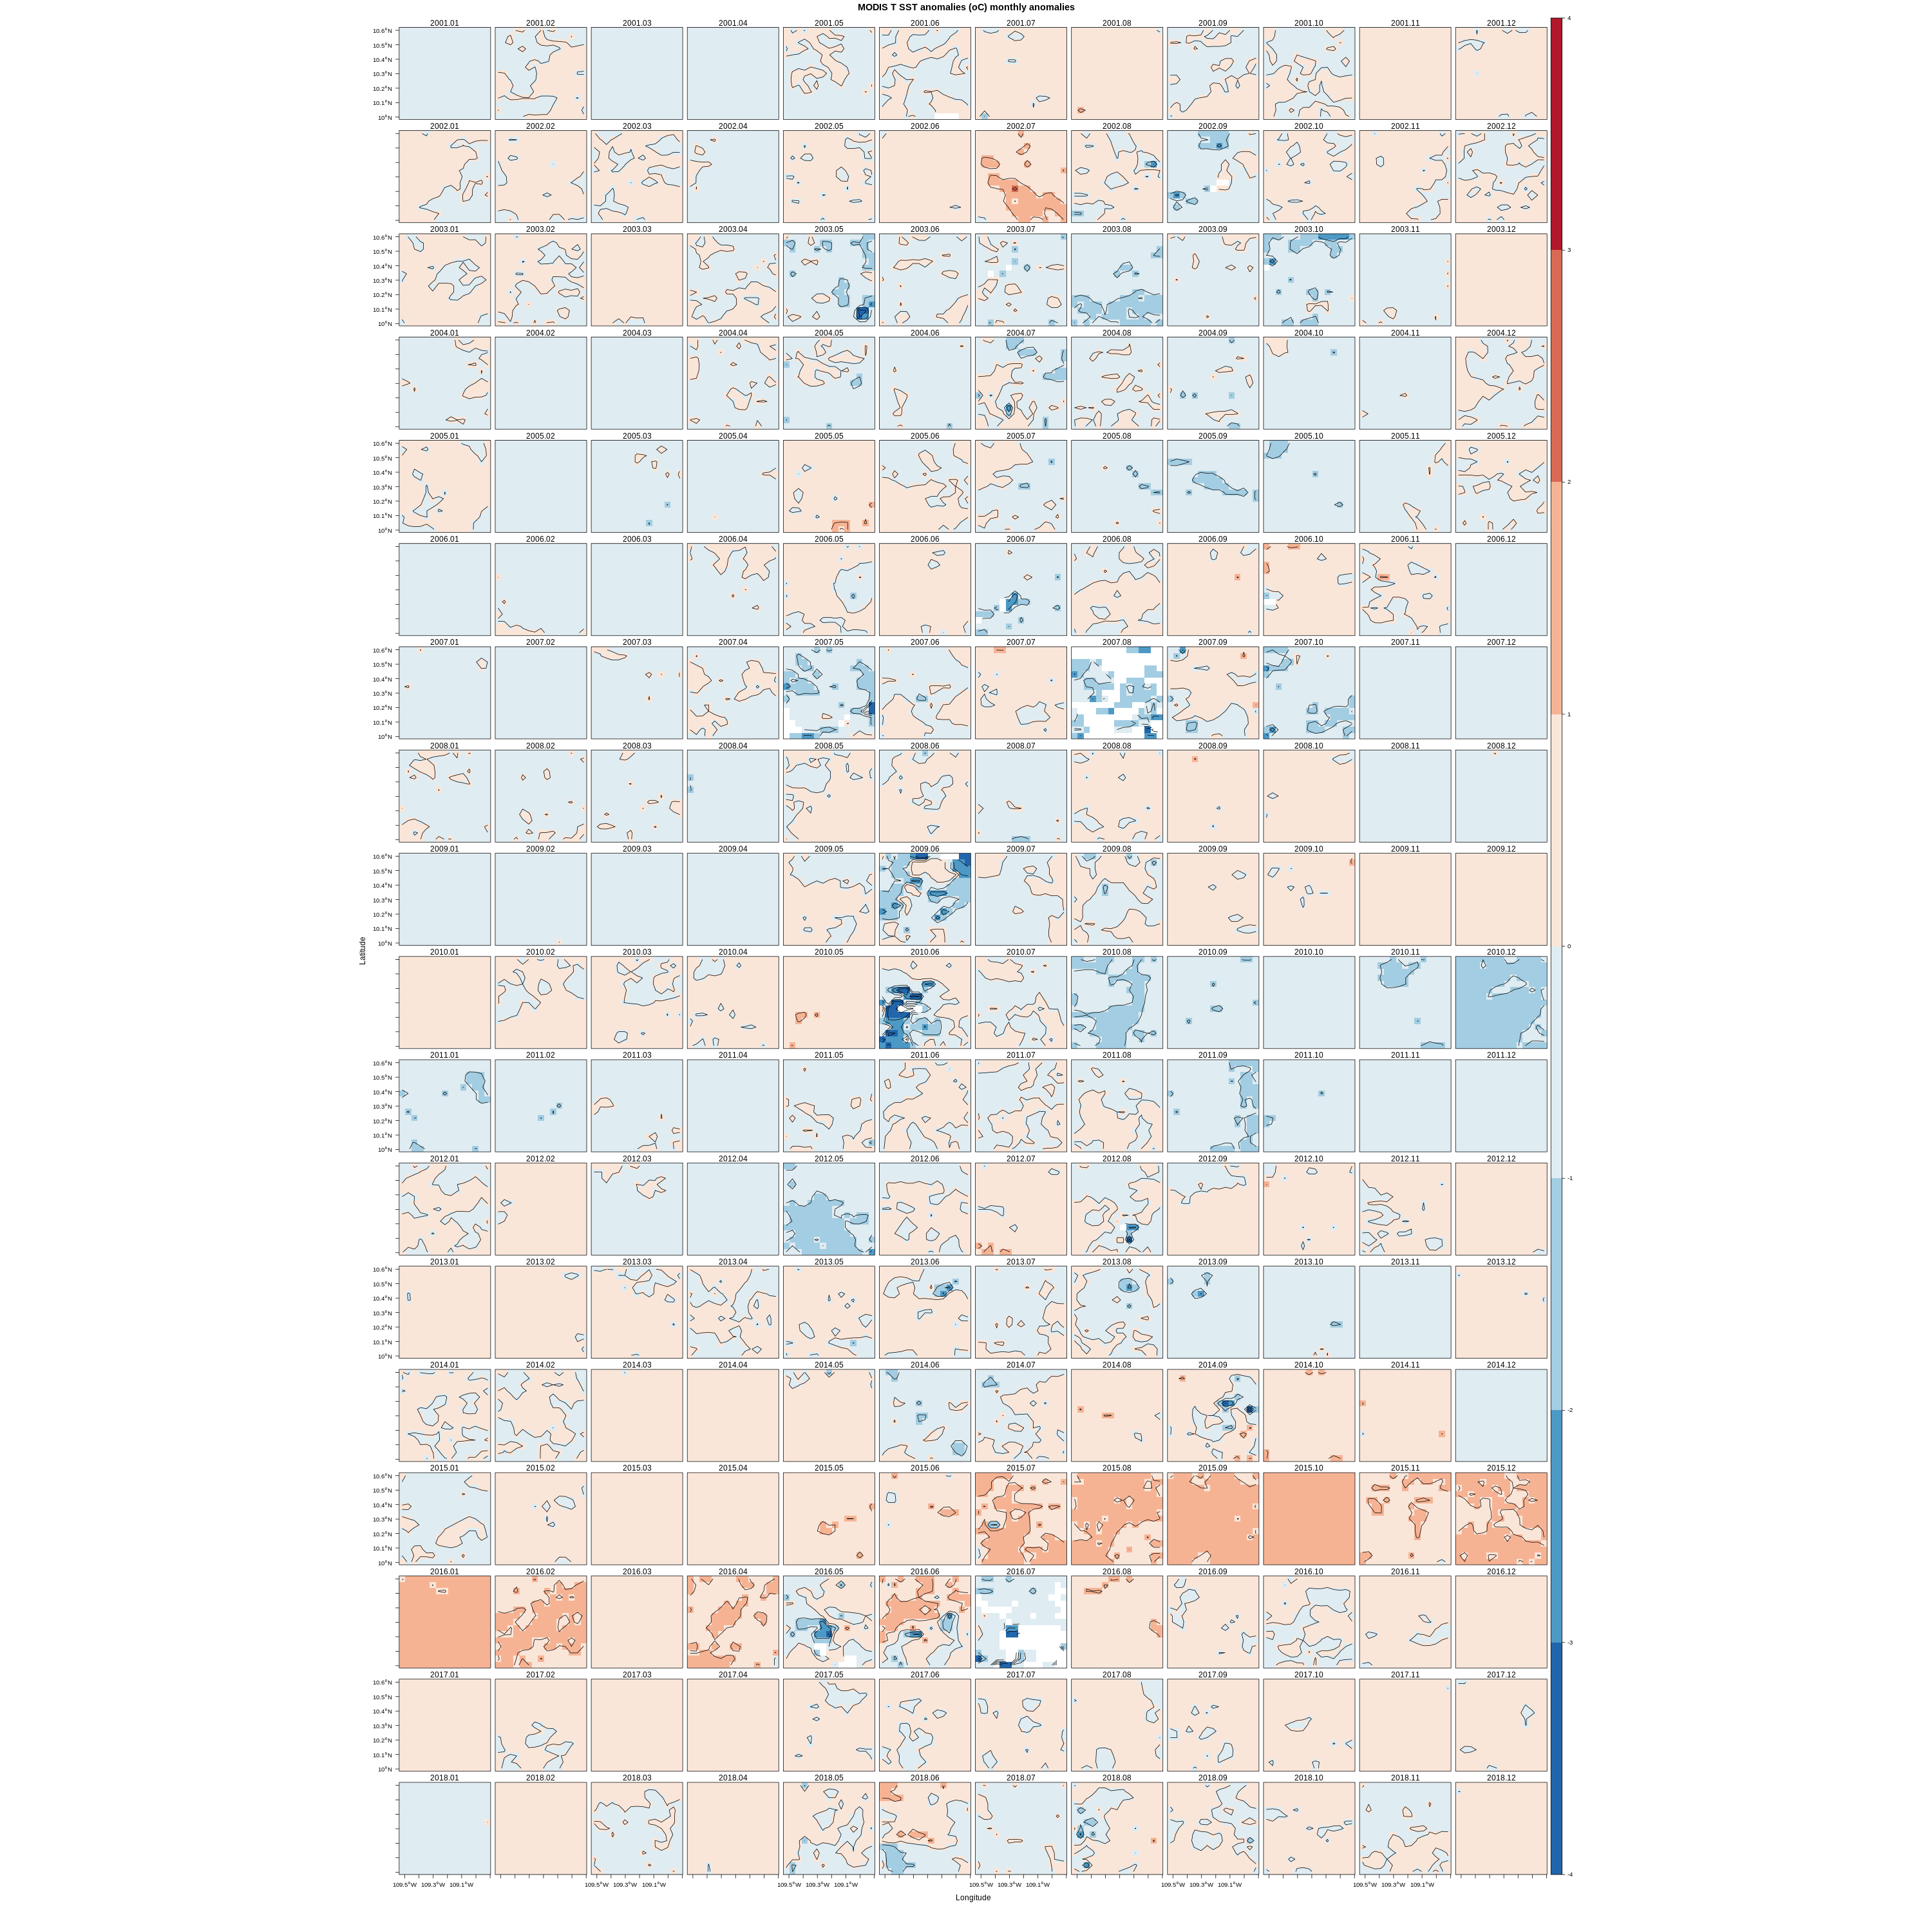
4.5 Anomalies
5 Analysis (data)
5.1 Average seasonal decomposition

5.2 Download
| name | unite | timerange | pixelnb | fracnbna | fractsna | mean | sd | min | max | varseason | vartrend | trendtest | sen.slope |
|---|---|---|---|---|---|---|---|---|---|---|---|---|---|
| MODIS T SST | oC | 2001.01/2018.12 | 121 | 0.41 | 0 | 27.97821 | 0.6870454 | 22.725 | 30.26 | 52.80894 | 4.782138 | 0 | 0.026794 |
Download analysis data (csv) [Time,“Time series”,“Seasonal component”,“Trend”,“Residual”]