Dataset: Chlorophyll-a 1998-2018
Document produced by http://www.marine-analyst.eu
12 September, 2021

1 MPA information
|
2 Data information
|
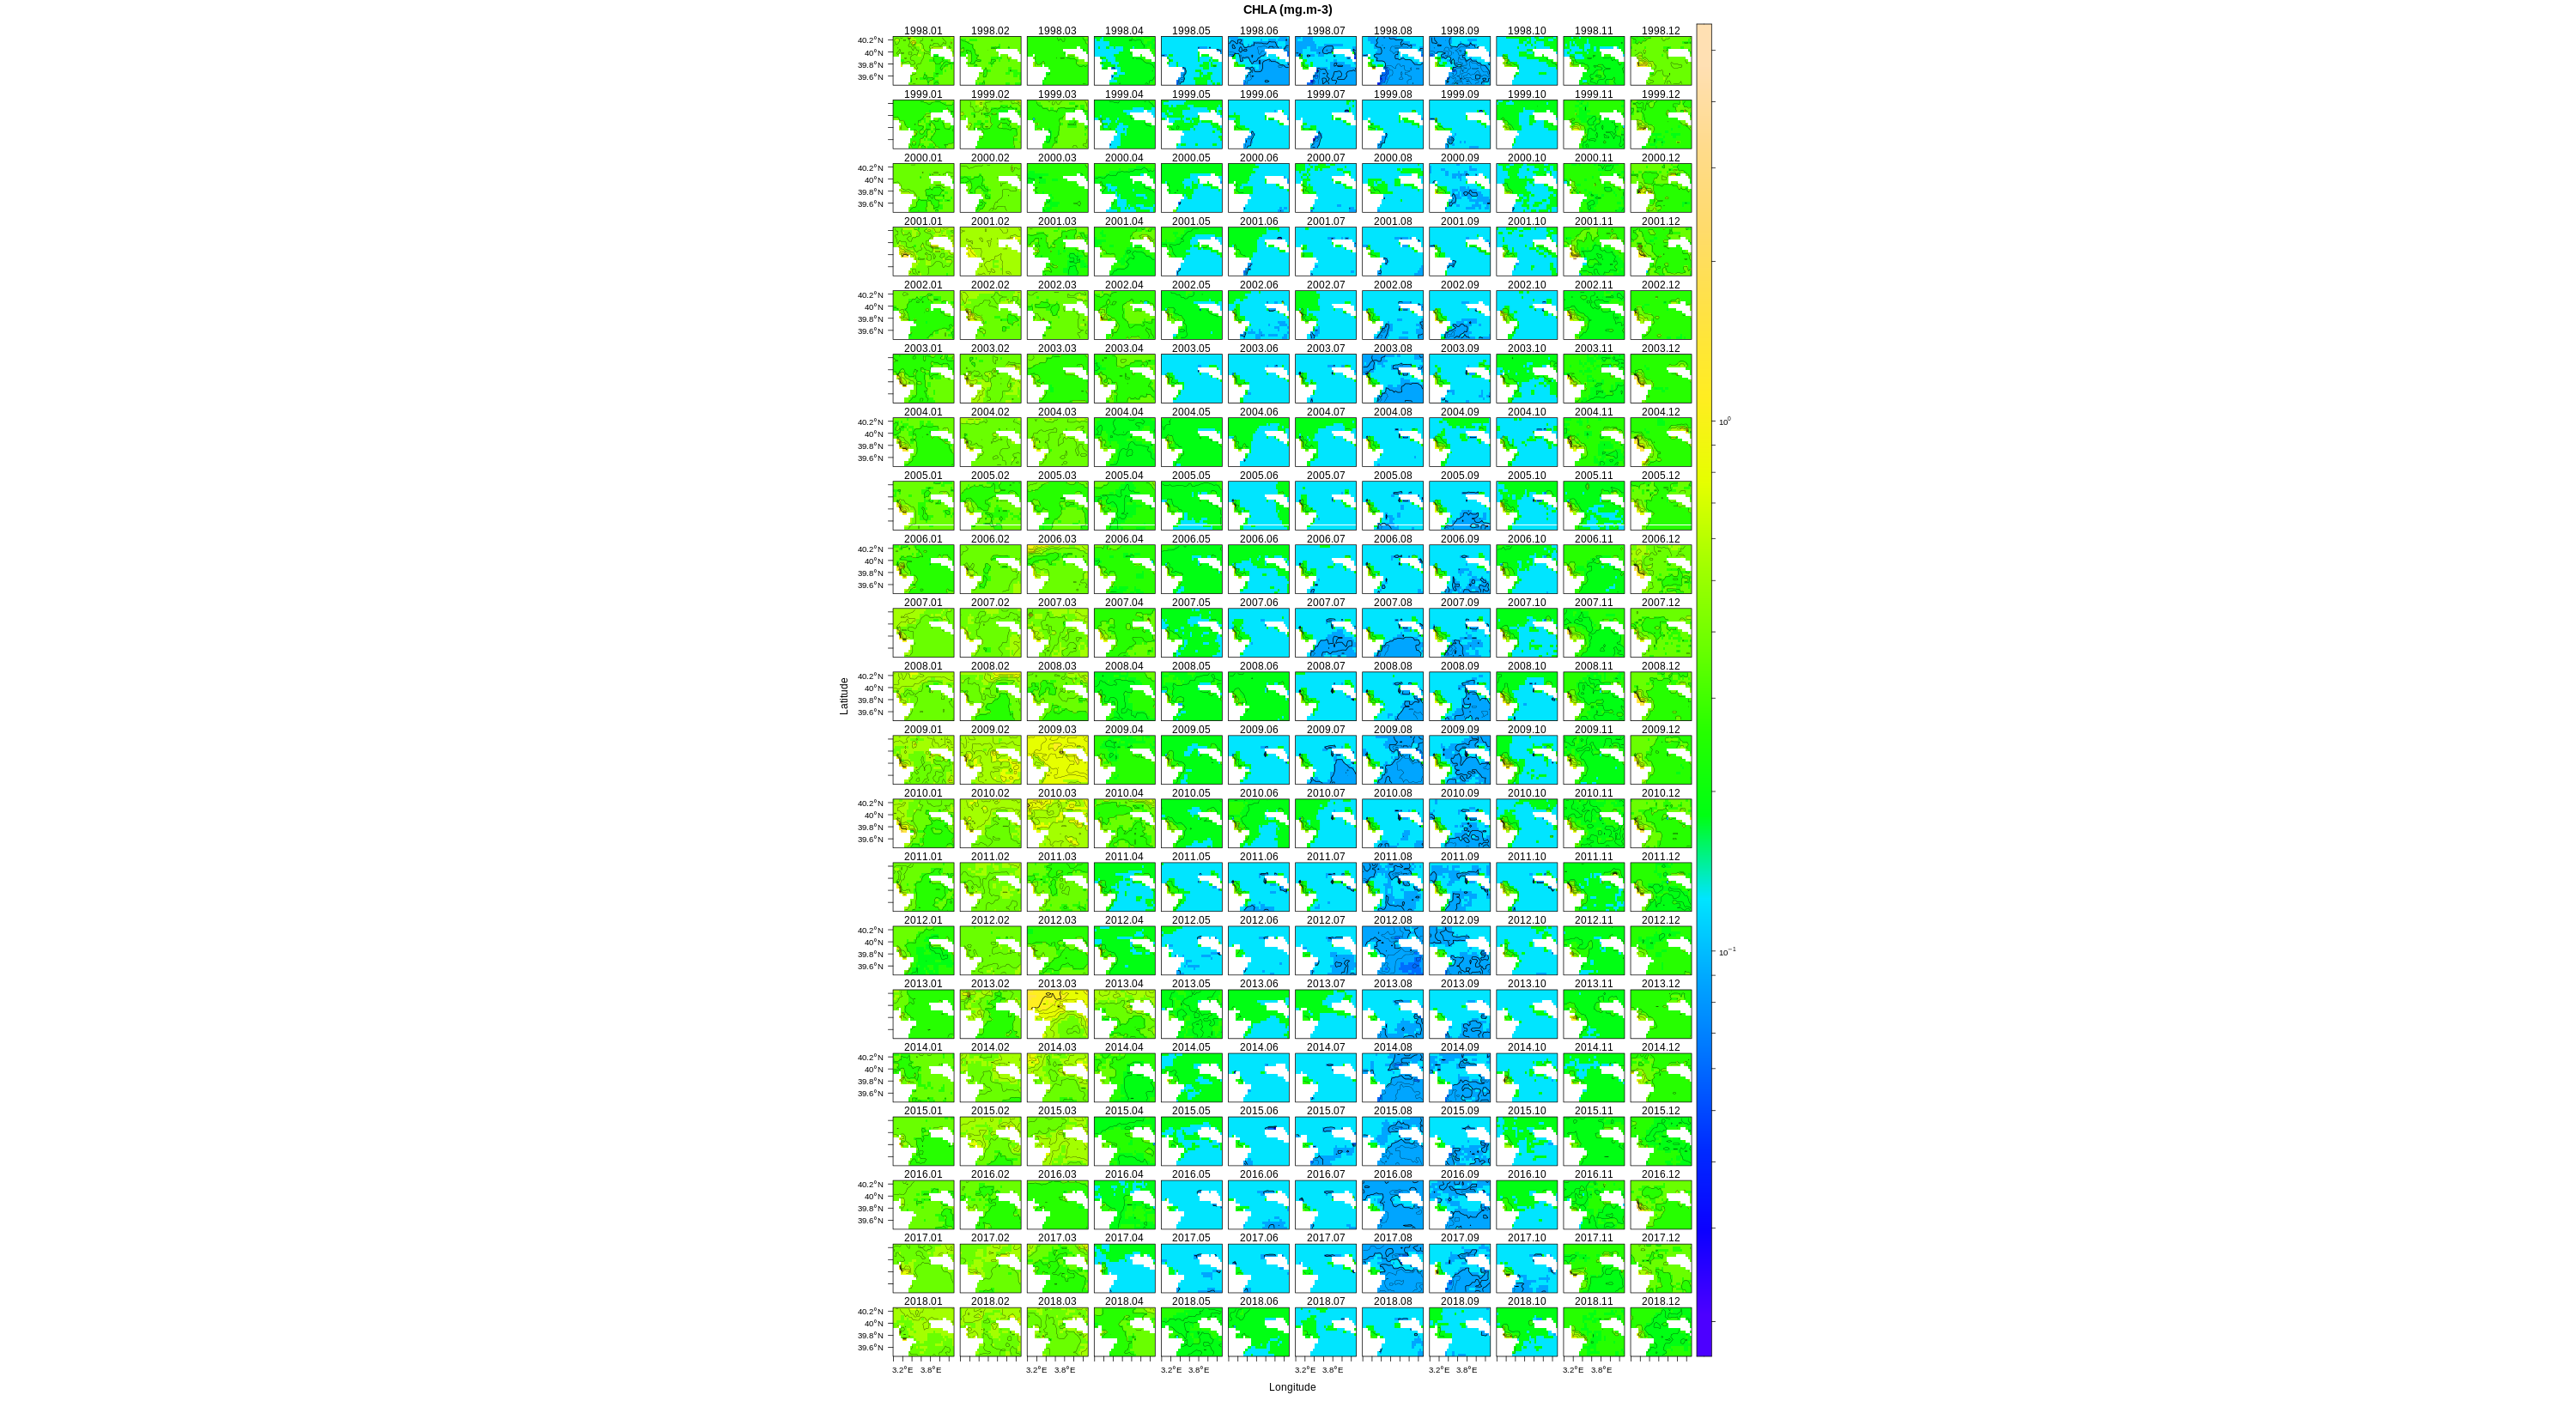
Monthly mean sea surface Chlorophyll-a concentration (in mg.m^-3 (log10) at 4km resolution - Satellite remote sensing Ocean color data): Chlorophyll is a photosynthetic pigment commonly present in all phytoplankton species. It is used as a proxy for phytoplankton biomass. Chlorophyll concentration is a standard product from satellite-based optical sensors, usually retrieved from empirical algorithms using reflectance ratios at two or more wavebands.
|
Access metadata from landing page
3 Geographical extent
3.1 Coordinates
## [1] "West-Longitude: 3.09"## [1] "South-Latitude: 39.55"## [1] "East-Longitude: 4.21"## [1] "North-Latitude: 40.16"3.2 Defined area
 Map tiles by Stamen Design, under CC BY 3.0. Data by OpenStreetMap, under ODbL.
4 Analysis (graphs)
4.1 Monthly composite
4.2 Average

4.3 Monthly climatology

4.4 Monthly boxplot

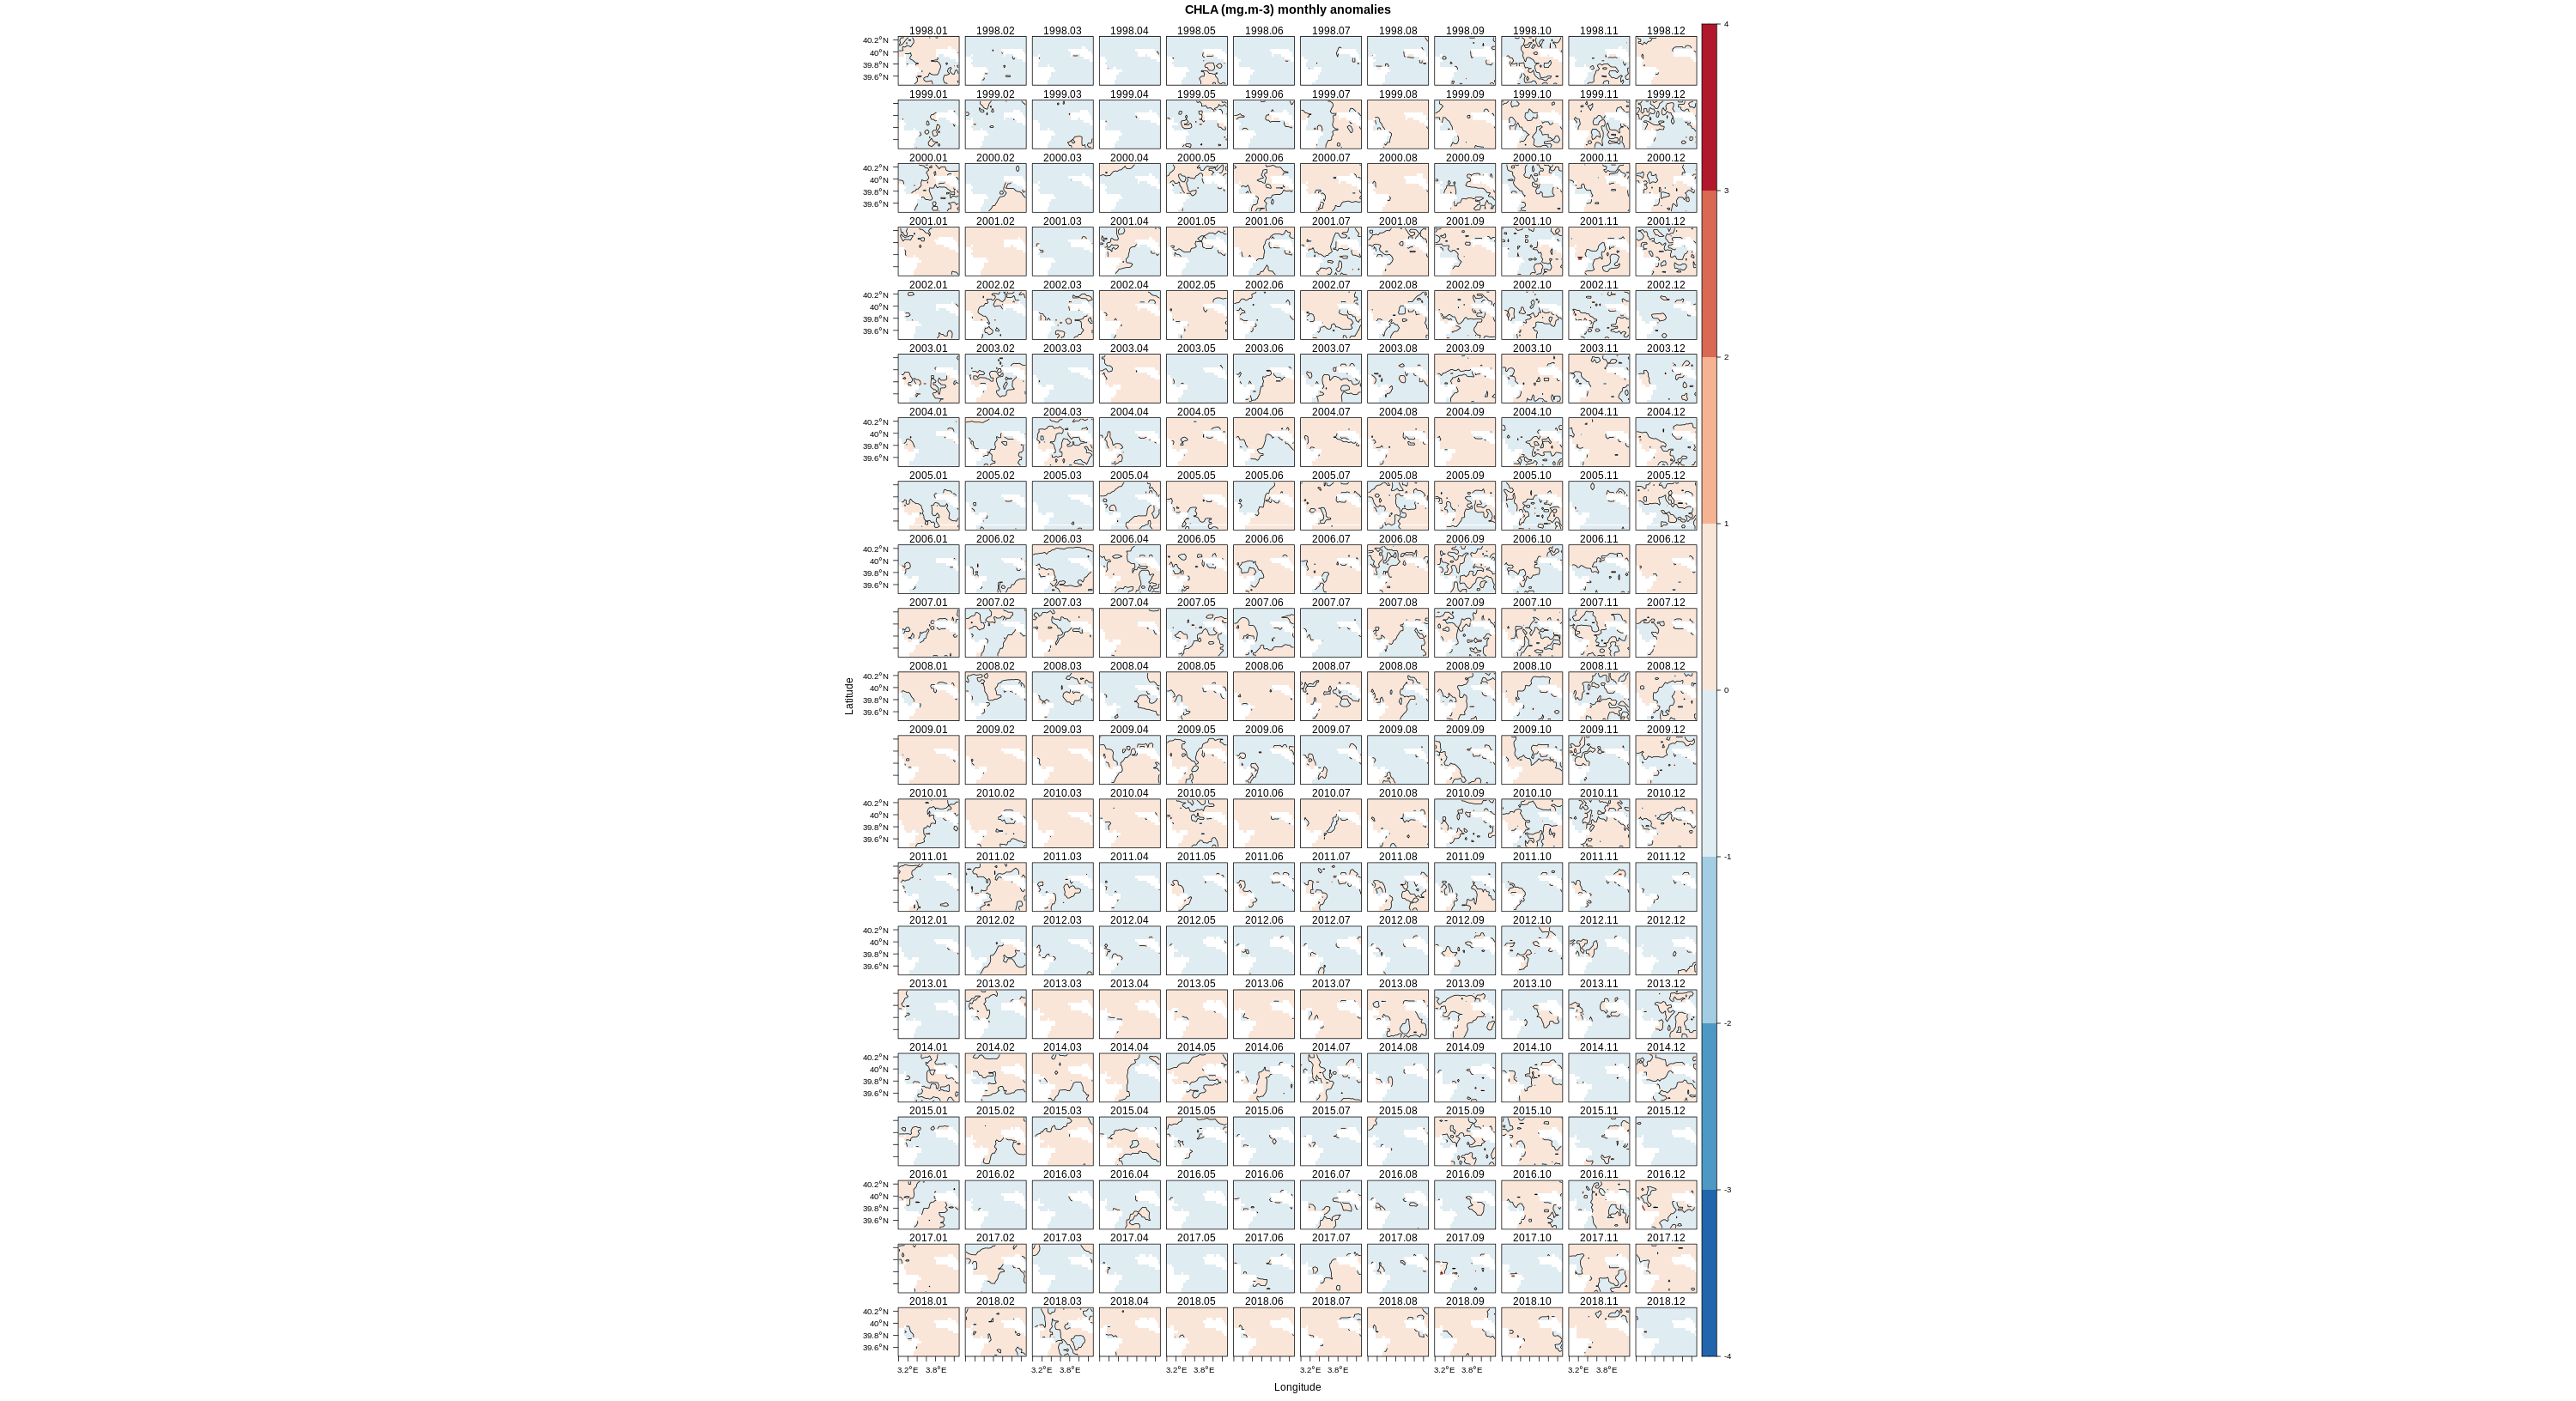
4.5 Anomalies
5 Analysis (data)
5.1 Average seasonal decomposition

5.2 Download
| name | unite | timerange | pixelnb | fracnbna | fractsna | mean | sd | min | max | varseason | vartrend | trendtest | sen.slope |
|---|---|---|---|---|---|---|---|---|---|---|---|---|---|
| CHLA | mg.m-3 | 1998.01/2018.12 | 209 | 0.78 | 0 | 0.2172487 | 0.1193805 | 0.0345369 | 1.186486 | 80.79002 | 0.1949886 | 0 | 0.0008392 |
Download analysis data (csv) [Time,“Time series”,“Seasonal component”,“Trend”,“Residual”]